The mean is a way of measuring the center of a data set. That is, it is a way of trying to describe the typical data value. For symmetric data sets, it does a good job of this. But, for skewed data sets or data sets with outliers it can be a bit misleading. Before we see how it is calculated, let’s talk about notation.
[adsenseWide]
Notation
The mean is represented in two different ways, depending on whether or not it represents the mean of a sample or the mean of a population. Both are calculated the same, and the difference between the two is only important in some settings.
| Population Mean | Sample Mean |
|---|---|
 (This is the Greek letter Mu. Read this as “mew”.) |
 (Read this as “x-bar”.) |
For this guide, we will assume that we are working with sample data, so we will use
Calculation Using the Formula
When you learned how to find the average, you were likely taught the arithmetic average. This is where you add up all the values and then divide by however many values were in the data set. The mean is calculated in the exact same way.
Example
Find the mean of the data set below.
| 10 | 12 | 11 | 8 | 14 | 12 |
Using the idea above:
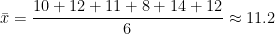
So, the mean for this data set is approximately 11.2. Looking at the original data, this does a good job of describing the center of this data set.
Calculation Using a TI83 or TI84 Graphing Calculator
The mean can easily be found using the function 1varstats on Ti83/84 graphing calculators. Here, we will go through the steps one by one. If you want to see a video of how to do this, scroll down to the bottom (or click here)!
Step 1: Enter your data in L1
To enter data in your calculator, press [STAT] and then go to 1: Edit by pressing [ENTER] or [1].


Now to enter the data, type each number and press enter. Note that if you already have data in your list, highlight the very top where it says L1 and press [CLEAR] followed by [ENTER].

Step 2: Calculate 1-var-stats
Once your data is in the list, press [STAT] again and then go to the CALC menu. From here, choose 1: 1varstats.

Now press enter twice and you will get a list of summary statistics. The first value that comes up is the mean!


Note: if you have a newer calculator, the menu looks a little different now. Instead of pressing enter twice, you will press enter and then have a 1-var stats menu come up. Just click CALCULATE at this menu and you will have the same information come up as you see above.
As you can see we get the exact same value as we did above. This is very nice for working with larger data sets.