The correlation coefficient is very useful for understanding how strong the linear relationship is between two variables. The only problem is that it is quite messy and tedious to find by hand! And as I have mentioned many times before: statisticians do not find these things by hand. They interpret the results from software or other calculators.
[adsenseWide]
For most students, the easiest way to calculate the correlation coefficient is to use their graphing calculator. It is a VERY easy process an here, I will go through each of the steps needed. (For a video that shows all of these steps, be sure to scroll down!)
Step 0: Turn on Diagnostics
You will only need to do this step once on your calculator. After that, you can always start at step 1 below. If you don’t do this, r will not show up when you run the linear regression function.
Press [2nd] and then [0] to enter your calculator’s catalog. Scroll until you see “diagnosticsOn”.


Press enter until the calculator screen says “Done”.


This is important to repeat: You never have to do this again unless you reset your calculator or start using someone elses! This will be set up from now on.
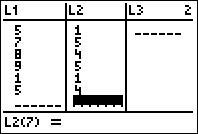
Step 2: Enter Data
Enter your data into the calculator by pressing [STAT] and then selecting 1:Edit. To make things easier, you should enter all of your “x data” into L1 and all of your “y data” into L2.
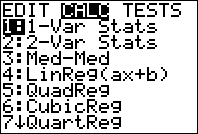
Step 3: Calculate!
Once you have your data in, you will now go to [STAT] and then the CALC menu up top. Finally, select 4:LinReg and press enter.

Video
The following video will walk you through the steps you see above!