Graphing calculators such as the TI83 and TI84 are able to do many different operations with matrices, including multiplication. Here, we will go over the steps needed to multiply two matrices in this type of calculator using the following example.
Table of Contents
[adsenseWide]
Step-by-step with an example
Find the product of the matrices.
\(AB=\left[\begin{array}{ccc}-1 & 5 & -2\\ 3 & 7 & 7\\\end{array}\right]\left[\begin{array}{cc}4 & 0\\ 1 & 1\\ 3 & 9\end{array}\right]\)
Step 1: Enter the first matrix into the calculator
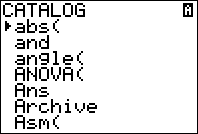
To enter a matrix, press [2ND] and \(\left[x^{-1}\right]\).
(Note: some older models of the TI83 calculators have a MATRIX button)

Use the right arrow key to go to the EDIT menu.

Press enter to select matrix A.

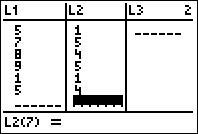
Type in the size of the matrix and the values by typing each number and pressing [ENTER]. Note that the first matrix is a 2 x 3 matrix (rows by columns).
\(A=\left[\begin{array}{ccc}-1 & 5 & -2\\ 3 & 7 & 7\\\end{array}\right]\)

Step 2: Enter the second matrix into the calculator
Press [2ND] and \(\left[x^{-1}\right]\).

Press the right arrow key to go to the EDIT menu.

Press [2] or highlight 2. [B] and press [ENTER].

Type in the size of the matrix and the values by typing each number and pressing [ENTER]. Note that the second matrix from our example is a 3 x 2 matrix (rows by columns).
\(\left[\begin{array}{cc}4 & 0\\ 1 & 1\\ 3 & 9\end{array}\right]\)

Step 3: Press [2ND] and [MODE] to quit out of the matrix screen
This will take you to a blank screen. If you skip this step, your calculator may (depending on where your cursor is) try to put matrix A inside of matrix B, causing an error.
Step 4: Select matrix A and matrix B in the NAMES menu to find the product
From the blank screen, press [2ND] and \(\left[x^{-1}\right]\) and stay at the NAMES menu.

Press [ENTER] to select matrix [A].

To select matrix [B], go back into the matrix menu by pressing [2ND] and \(\left[x^{-1}\right]\).

Press [2] or highlight 2. [B] and press [ENTER].

Press [ENTER] to multiply the matrices.

From here, you have your final answer. We can now write:
\(\begin{align} AB &=\left[\begin{array}{ccc}-1 & 5 & -2\\ 3 & 7 & 7\\\end{array}\right]\left[\begin{array}{cc}4 & 0\\ 1 & 1\\ 3 & 9\end{array}\right]
\\ &=\boxed{\left[\begin{array}{cc}-5 & -13\\ 40 & 70\\\end{array}\right]}\end{align}\)
Common error: DIM MISMATCH
Suppose that you go through these steps and end up with the following screen.

In this case, you should check two things:
- Did you enter the correct matrix information and did you select the correct matrices to multiply?
- Is the product defined?
If you entered the matrices correctly, then this error means that the product is undefined. Specifically, if you write out the sizes of the matrices, the inner numbers must match. In the example above, we had a 2 x 3 and a 3 x 2. Notice that the numbers on the inside match, so the product was defined and we were able to find an answer.
However, the product of a 2 x 2 and a 3 x 2 would be undefined since the inner numbers do not match. You would simply write “Undefined” as your answer if you were working a problem like this on an exam or quiz.
To read more about when matrix multiplication is or isn’t defined, see the following link.
When is matrix multiplication defined?
[adsenseLargeRectangle]
Continue your study of matrices and the TI83 / 84 calculator
The following articles have more information about using the calculator with matrices: